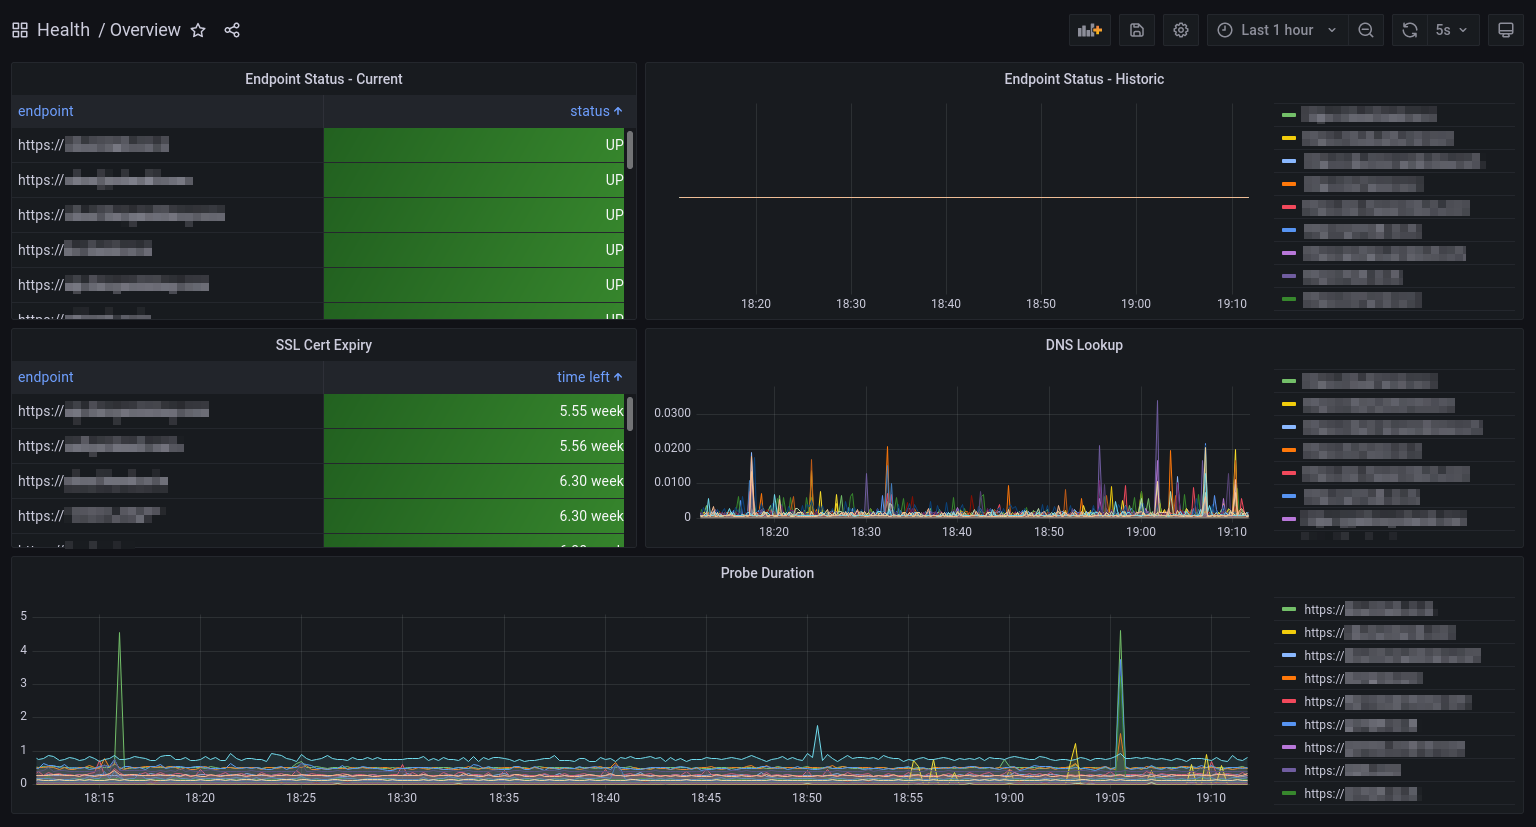
This is our Monitoring Dashboard. It shows a real-time overview of the current status of the network, including which endpoints are up (and which endpoints are down), SSL certificate expiration (even though we provide free automated certificate renewal), load time, and DNS lookup time. It also includes a graph of these items over time.
Every minute, all of the tracked endpoints in our network are analyzed by our Endpoint Monitor, one by one. Depending on the service, the Endpoint Monitor may issue an ICMP ping, an HTTP/s GET request, or a simple TCP CONNECT. The result of each test is then added to our Monitoring Database and rendered as you see here by the Monitoring Dashboard.
The Monitoring Dashboard is both responsible for displaying a nice overview of the status of the network and for generating alerts if a service goes down. If a service ever goes down for more than a few minutes, an email is fired off to our staff and the problem is dealt with as quickly as possible.
The Monitoring Dashboard is then connected to the JSI API, allowing end users (and JordanSLT.com) to retrieve information about the network. As of the time of writing, our API only provides an overview of network status, but it will be expanded in the future to allow our clients to pull up information about their own services.

This is just one of the many features that makes our Managed Hosting service tick. Contact us using the form below to learn more about how our services work and how we can use them to help you build your business.